Custom Solar Solutions That Power Your Projects Forward

Every project gets dedicated support, tailored solutions, and real-time updates.

Sensors on transmission lines over dry terrain for wildfire monitoring.

Transmission Line Galloping Monitoring Device

Detect wind-induced conductor motion before it damages hardware or triggers faults. A self-powered node designed for utility monitoring programs and grid monitoring solutions.

Why Galloping Monitoring Matters

For utilities, conductor galloping is not just “movement”—it’s a reliability and asset-life problem. Large-amplitude, low-frequency oscillations can stress fittings and hardware, increase flashover risk, and trigger repeated patrol and repair cycles. In many regions, the worst galloping spans are also the hardest to access, making continuous overhead line monitoring far more efficient than periodic inspection.

A modern grid monitoring solution treats galloping as a condition signal that should be captured continuously, correlated with weather and span conditions, and converted into clear, event-based alerts.

Solar-powered_fault_location_device_ls-fd101

What the WD Device Measures

WD is designed as an edge node for transmission line monitoring programs. It helps your team answer three operational questions:

Is galloping happening right now—and how severe is it?

WD measures galloping motion indicators (amplitude and frequency) to quantify event severity instead of relying on subjective visual reports.

Which span is risky—and what changed?

By collecting trends over time, WD helps identify spans with repeated events, supporting corridor risk ranking and targeted mitigation planning.

Can we reduce false dispatch?

WD supports configurable reporting intervals and threshold-based alarms so teams can tune “dispatch rules” based on their own operating standards.

LINKSOLAR Transmission Line Galloping Monitoring Device

Key Monitoring Capabilities

Conductor galloping monitoring

  • Tracks galloping amplitude and galloping frequency for event detection
  • Enables both real-time alerting and historical event review

Supporting condition signals

  • Conductor temperature and environmental context signals (ambient temperature/humidity, depending on configuration) help interpret why events happen and when risk increases

Remote monitoring + real-time alert workflow

WD is deployed as part of a larger power line monitoring system: edge node → wireless link/gateway → visual display platform/dashboard → alarm and reporting workflow.

A power transmission tower has small solar panels and white junction boxes installed on its internal structure.

How It Fits into a Power Line Monitoring System Architecture

Use this short “system fit” section to align with how utilities buy:

Typical deployment architecture

  1. WD node is installed on the conductor at the target span
  2. Data is transmitted via standard 2.4GHz wireless (or project-defined low-power long-range option) to a receiver/gateway
  3. Gateway forwards data to your monitoring platform (cloud or on-prem)
  4. Operators view events on a visual display platform and receive real-time alerts based on configured rules

Works for both transmission and distribution programs

While WD is typically positioned for transmission corridors, many utilities run unified dashboards where distribution network monitoring and transmission line monitoring share the same alerting and asset workflows. WD data can be organized by feeder/corridor/span to match your internal structure.

High Wind Corridor Overhead Line Galloping Monitoring-LinkSolar

Best-fit Scenarios

  • High-wind corridors (mountain passes, coastal lines, valley acceleration zones)
  • Long-span crossings (river crossings, canyons, wide ROW sections)
  • Icing + wind coupling areas where motion events repeat seasonally
  • Utilities upgrading from manual patrols to event-driven overhead line monitoring

Key Specifications

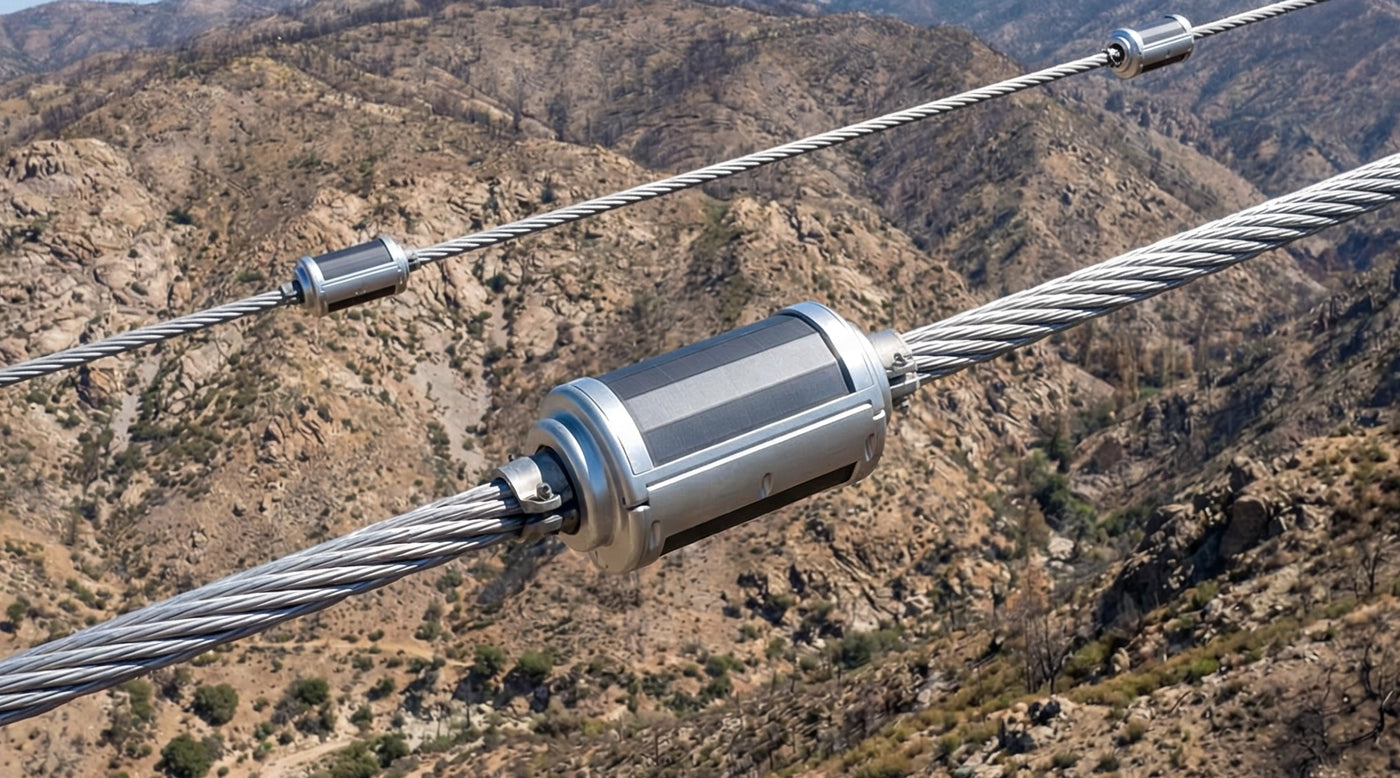
A self-powered node for overhead line monitoring programs, supporting continuous transmission line monitoring and event alarms as part of a larger power line monitoring system.

Item Spec
Model LS-3V7WD11010
Application 35kV and above overhead transmission lines
Power Solar powered + internal rechargeable battery
Solar Panel (typical) Standard power 2W (±5%); nominal working voltage 6V (±10%); conversion efficiency 22%
Battery Nominal voltage 3.7V; capacity 6Ah
Autonomy reference Up to ~30 days standby (example: 5-min reporting without charging; depends on conditions)
Wireless / Comms Supports 2.4G (standard); can be customized with low-power wireless (e.g., LoRa/LoRaWAN) and gateway/RS485 bridging depending on project
Max TX power / range (reference) Up to 22 dBm, up to 500m in open area (deployment-dependent)
Galloping amplitude 0–20m
Galloping frequency 0.1–5Hz
Positioning accuracy (horizontal) 1cm + 1ppm
Positioning accuracy (vertical) 2cm + 1ppm
Material Aluminum alloy
Ingress Protection IP66
Operating Temp (spec table) -40°C to +85°C
Dimensions Diameter 98mm; Length 200mm
Weight <2kg

Deployment Guidance

Pilot-first is the fastest path to rollout

Most utilities validate galloping monitoring with a small pilot:

  • Choose 2–5 spans: one known high-risk span + a representative normal span
  • Start with a conservative reporting interval and alarm threshold
  • Collect baseline event data through a weather cycle
  • Tune alarm rules to match your dispatch and maintenance criteria
  • Standardize the configuration for scaled corridor deployment

Reduce false alarms with threshold strategy

A good galloping alarm is not “any motion.” It’s motion that meets severity + duration rules that your team agrees should trigger action. WD supports threshold configuration so alarms align with what you consider “actionable.”

Frequently Asked Questions

What exactly does WD measure, and how is “galloping” quantified?

WD captures galloping behavior using motion indicators and outputs measurable parameters such as amplitude (0–20m) and frequency (0.1–5Hz). This turns galloping from “observations” into quantifiable events your team can trend, compare by span, and use for maintenance prioritization.

How do we set alarms to avoid false dispatch?

We recommend a pilot-based threshold approach: start with conservative thresholds, collect baseline data through real weather events, then tune severity and duration rules to match your dispatch criteria. WD supports configurable reporting intervals and threshold settings, so alerts align with what your operations team considers actionable.

What wireless range can we expect, and do we need a gateway?

Real range depends on terrain, conductor height, and RF interference. As a reference, transmission can reach up to 500m in open areas. Most corridor deployments use a receiver/gateway strategy to consolidate nodes and forward data to your platform.

How does WD stay online during harsh winter or low-sun periods?

WD is self-powered with a 2W solar panel + 3.7V 6Ah battery. Uptime depends on sunlight and reporting behavior. In harsh winters, many utilities use an event-driven strategy (event alarms + scheduled summaries) to keep critical monitoring online while managing energy budget.

Can WD integrate into our existing power line monitoring system platform?

Yes. WD is designed as an edge node within a broader power line monitoring system. In typical deployments, a gateway forwards WD data to a monitoring platform where your team views events on a visual display dashboard and configures alerts. Pilot planning is the best step to confirm the exact data flow, cadence, and alarm logic for your system.

Contact Us for a Quote & Technical Review

Tell us what you’re building and where it will be deployed. We’ll recommend a suitable configuration and provide a fast quotation.
Typical response: within 24–48 hours (business days).